Executive Summary
The United States (U.S.) beef industry strives to meet consumer demand for quality beef through continuous improvements across the supply chain. Within the feedyard sector, improvements in animal health, well-being, genetics, and ration innovations have led to substantial advances in production efficiencies and directly contribute to more efficiently and sustainably meeting supply chain needs. Since 1999, a sizable portion of the feedyard industry has shared performance data as part of a compilation database known as Elanco Benchmark®, which has enabled producers to use data summaries and in-depth analyses to drive continuous improvement. Over the last 24 years, feedyards within the Benchmark database have seen an increase in live harvest weight per animal by 172 (+14.3%) pounds, pounds of gain within the feedyard by 153 pounds (+32.9%) and carcass weight by 99 (+13.0%) pounds. The increases are a result in part due to 45 additional days on feed (DOF) on average, while maintaining or improving average daily gain (+0.09 pounds per day or +2.9% 2022 compared to 1999) and yield (+0.21%, 2022 compared to 1999). During this same time, only a slight increase in the feed to gain (F:G) ratio has been observed. Increasing F:G ratio corresponds to decreased efficiency. The performance metrics: live harvest weight, pounds of gain, carcass weight, dressing percentage, average daily gain, and F:G ratio are commonly accepted by the industry as measures of feedyard efficiency and yield. Five of the six metrics are showing improvements in line with the U.S. Round Table for Sustainable Beef (USRSB) goal to “continue to enhance cattle performance and feedyard efficiency.” The F:G ratio has increased since 2019 because the percentage of cattle within the dataset raised without one or more technologies has increased (ex. dry rolled corn vs. steam flaked corn, non-use of hormone implants and non-use of beta-agonists). Two performance metrics are presented as useful proxies for evaluating reduction in emissions per pound of beef in the feedyard when holding many other production practices constant: pounds of gain at constant DOF and F:G ratio when DOF are not constant. The live harvest weight improvements came with only a marginal change (+19 pounds, +2.6%) of average placement weight of animals in the feedyard. When comparing 2022 to 1999 and extrapolating the metrics observed from Elanco Benchmark to the entire industry, feedyards were able to gain 32.9% more total weight in 29.4% more days, enabling the industry to produce 28.3 billion pounds of beef with only 26.6 million steers and heifers slaughtered.1 If using production practices from 1999, the U.S. would have required 3.47 million more steers and heifers than 2022 to produce the same amount of beef (+13% improvement) and likely would have produced many more greenhouse gas (GHG) emissions.
Why is Elanco publishing a white paper on feedyard cattle performance?
Elanco aims to support the U.S. beef industry in their goals for continuous improvement and to help accurately account for greenhouse gas emissions and productivity in the feedyard sector. Elanco has shared data in the past for a variety of purposes: to investigate population mortality trends2,3, show impacts of hormone implant protocols on performance4, to correlate factors impacting cattle mobility5, estimate carcass performance metrics6, for producer meetings and to appropriately benchmark performance versus regional/national peers. In this instance, data from Benchmark can be used to support a better understanding of GHG emissions and productivity in the U.S. feedyard sector.
Each year the U.S. Environmental Protection Agency (EPA) publishes the official U.S. Inventory of Greenhouse Gas Emissions and Sinks. This report provides insights into the direct emissions from the feedyard sector. However, the predictive models used to determine direct emissions do not accurately account for changes in feedyard production over the years. The Elanco Benchmark service can provide more accurate data to better estimate direct emissions from the U.S. feedyard sector.
What are the allowable uses of the Data in this paper?
To publicly share data, Elanco has strict data management rules as part of the Benchmark user agreement. Data may only be shared in an aggregated form that maintains producer anonymity. “Data” from Benchmark includes placement weight, live harvest weight, DOF, average hot carcass weight, average daily feed intake, feed to gain ratio, average daily gain, pounds of gain at feedyard, dressing percentage (hot carcass weight / live harvest weight), number of feedyards, lots and head harvested. Elanco owns all Data and retains all ownership and proprietary rights in and to the Data. Notwithstanding anything to the contrary, for the purposes herein, Elanco will allow the Data to be used under limited circumstances described in detail below.
Data can be used for non-commercial purposes only unless the user has prior written consent from Elanco. Prohibited uses of the Data include, but are not limited to, cattle procurement models, publicly reporting individual organizations progress of greenhouse gas emissions by supply chain partners or monetization of GHG emissions reductions. Explicitly allowed uses of the Data include the USRSB goals reporting, as a reference for scientific publications and to better inform the EPA feedyard emissions modeling. This limited right to use the Data shall not confer upon the user any ownership or proprietary rights in the Data. The Data must not be used or disclosed for any purpose not expressly permitted herein, without prior written consent from Elanco. All other rights in and to the Data are expressly reserved by Elanco.
Background on Elanco Benchmark
The Benchmark database is a compilation of performance data of North American beef feedyards starting in the late 1990s. Varied factors can impact cattle performance from bunk management, pen maintenance, weather, feeding regimen, type of cattle and type of feed source just to name a few. Benchmark was created to allow producers to evaluate how their operations’ cattle performance has changed over time and to compare it to their regional and national peers to drive continuous improvement. Daily lot cost, feed and health data along with individual cattle movement is sent directly to Elanco from the accounting system for those accounts participating in Benchmark. Initially, data collection used various methods, from Excel based data applications to accounting and health systems depending on availability for each account through a manual data pull. From 1999 until 2002, the data was faxed or sent via postal mail. Today, the system runs based on automatic daily interfaces (Figure 3) with 15 or more different commercially available feedyard accounting, animal health and feed delivery / milling software systems and several “in-house” feedyard software systems from the producers’ accounts to reduce human intervention and increase speed of information. The initial type of data collected still holds true today but was expanded in 2013 by the creation of the real-time data collection process. Information from the real-time data maintained closeout, daily feed records and animal health records but expanded by including cattle movement, defining factors of the cattle i.e., origin, breed, etc. in addition to specific details on when animals were medically treated and why.
Benchmark was created in 1997, growing to 184 producers in 11 states with almost 4.8M head harvested or 15.8% of the U.S. steer and heifer slaughter in 1999 (Figure 1). By 2022, the number of producers included in the data reached 566 in 25 states and 10.6M head of cattle or 39.8% of the U.S. steer and heifer slaughter (Figure 2). These numbers will vary as producers choose to enroll or unenroll in Benchmark. On average for the last five years (2018-2022), the average accretion rate of accounts was 104 while the average attrition rate was 26 accounts. Since 2018, Benchmark has recorded a sharp increase (+302) in accounts due to the addition of a new accounting program that enabled smaller accounts to participate in the program. The five years before 2018 resulted in a smaller accretion rate with the average being 23 for additions and 26 removals.
Historically, Benchmark participation has been driven by data integration capabilities and pharmaceutical use. Feedyards without software systems are much less likely to collect, record and enter the data required to participate resulting in a user base skewed to larger feedyards. In 2022, harvested cattle from feedyards that harvested less than 1,998 head (two turns of cattle at 999 head capacity) represented 1.90% of the Benchmark database. However, the United States Department of Agriculture (USDA) reports feedyards with less than 1,000 head capacity represent approximately 15% of harvested cattle.7 Elanco Benchmark data are provided in two forms. The first includes all feedyards within Benchmark (Table 3), while the second excludes feedyards submitting data from Performance Livestock Analytics (PLA; Table 4). According to the PLA website as of February 2024, their producer database represents 4.4 million cattle on feed and 2,600+ producers or ~1,692 cattle on feed per producer.8 Separating these customers from Benchmark enables the Benchmark data to be combined with PLA data to give a far more representative sample of cattle performance across customer size within the U.S. Additionally, feedyard participation in Benchmark has been tied to pharmaceutical use resulting in a population of feedyards more likely to feed their animals conventionally (grain finishing and using pharmaceuticals) than the total population of U.S. beef for slaughter. It should also be noted that the proportion of steers, heifers, mixed sex lots and Holsteins (dairy-influenced steers) within the database will vary on a yearly basis depending on market dynamics, herd liquidation and herd rebuilding. The mix of cattle types will influence the average performance reported but reflects the year-to-year complexities of the U.S. cattle feeding industry.
Figure 1. Number of Benchmark accounts in 1999 versus 2022 by state.
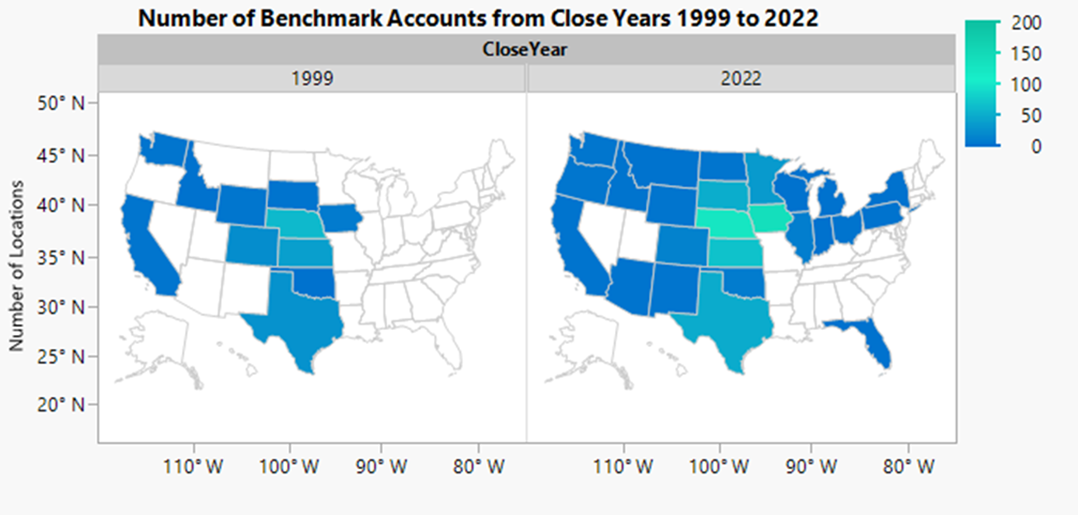
Figure 2. Total head in Benchmark in 1999 versus 2022, by state.

How Data are Collected
Today, the data collected from Benchmark customers runs through electronic data transfer methods. Elanco partners with accounting and animal health software systems to create an interface that will generate the data from the customer and then push the data to Benchmark via the electronic data transfer method selected. This system allows a “push” of the data versus a “pull” of the data from the account. By allowing the push, Benchmark is only receiving data sent from the customer versus entering the customer’s system to retrieve the data (Figure 3).
Figure 3. Process flow of data from customer to Benchmark.

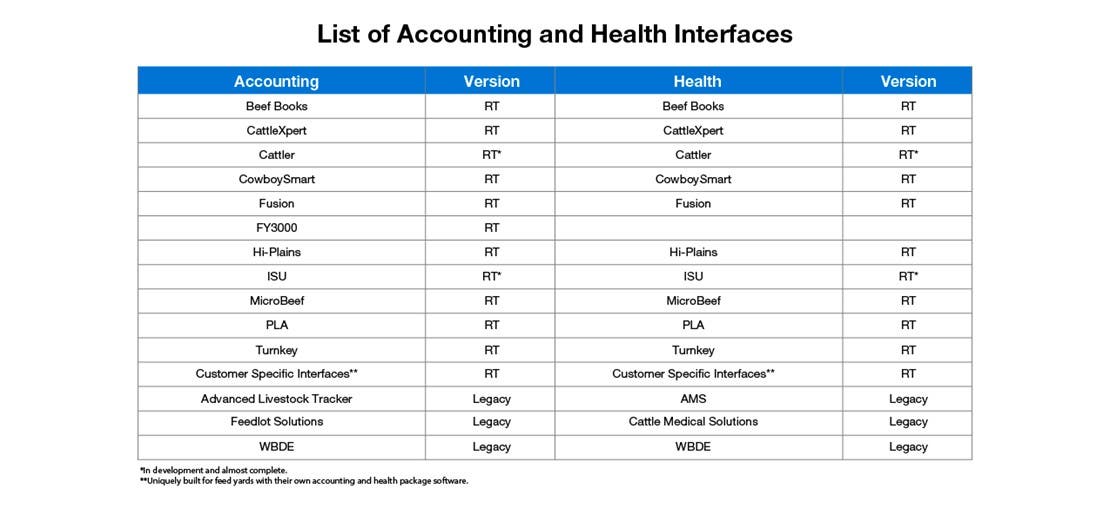
Currently Benchmark interfaces with 12 different real time and three legacy accounting and health software systems. Only 15 of the 566 (2.7%) accounts use the legacy accounting and health systems (Table 1). For these 15 accounts, the data are sent monthly to Benchmark rather than daily.
Overview of Data Quality Control Procedures
Table 1. Benchmark Interfacing Software Systems
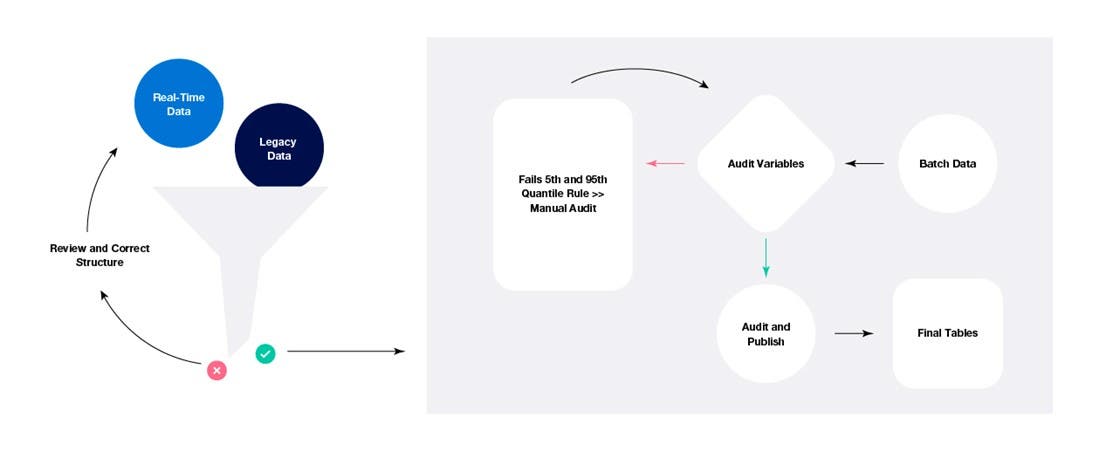
Once the data are sent to the server, they are then processed to ensure the structure has been maintained and no issues have arisen. If the file structure fails, the file will move to a holding folder to wait for a review of the file. Once the issue has been addressed, the file will be reprocessed. When the file structure passes, all data will then populate on the corresponding real-time (in-process or archive) tables as designated by the system. There are two types of lot definitions: in-process and archive. When the lot is still currently on feed, it is deemed an in-process lot. Once the lot closes i.e., all cattle in the lot have been accounted for through a sale or a death and feed is no longer being billed to the lot, the account officially marks the lot as closed. The lot is then deemed archived and will move to the real-time archive tables. Daily updates of the data will continue for both in-process and archived lots. After a lot has been closed for 30 days, the feed will no longer refresh the closed lot’s data. This functionality ensures any additional updates made to the lot by the account are still received and applied to the lot updates (Figure 4).
Each of these tables will consist of the raw data received, in addition, to calculated fields i.e., Average Daily Gain is a calculation of raw variables: Pounds Gained and Head Days (Table 2a and 2b). For this publication, In Weight is calculated on a head out basis to maintain consistency with other metrics. Additionally, the data are batched and processed once more using the data engine to determine if the calculated values fall outside of the 5th and 95th quantiles of the past rolling 12 months. If this does occur, the data are visually flagged for the business analysts, who will then manually verify/correct the data in question. After the data are matched, they are ready for publishing and sent to the final tables.
Figure 4. Data auditing process for Benchmark.
Additional data sent to Benchmark outside of software systems are carcass data. These data can be sent to Benchmark directly from the packer or from the account. In the case where data are sent directly from the packer, a completed release form from the account is sent to the packer to allow the dissemination of the data. When the harvested data are collected, the business analyst will match the received records to a lot in Benchmark so that the live and carcass performances can be used together. One last publishing occurs after the carcass data are received and matched, which then publishes data to a final set of tables used to create reports and analyses. Not all closeout records will have a corresponding carcass record due to the limitations of collecting these pieces of information. In 2022, Benchmark had a total of 70,667 closed lots with only 34% of the lots having carcass data i.e., average hot carcass weight and dressing percent associated to these records, leaving most of the closed lots with no associated carcass data (66%).
Table 2a. Raw variable definitions.

Table 2b. Calculated variable definitions.

Summary of Data
Appendices 1 and 2 provide an overview of all Benchmark data, which represents aggregated data for all user described cattle types of Steers, Heifers, Mixed and Holsteins. Appendix 1 includes both Benchmark and PLA data while Appendix 2 excludes data from PLA customers. Figures 5a-d provide visual representation of industry trends from 1999 to 2022.
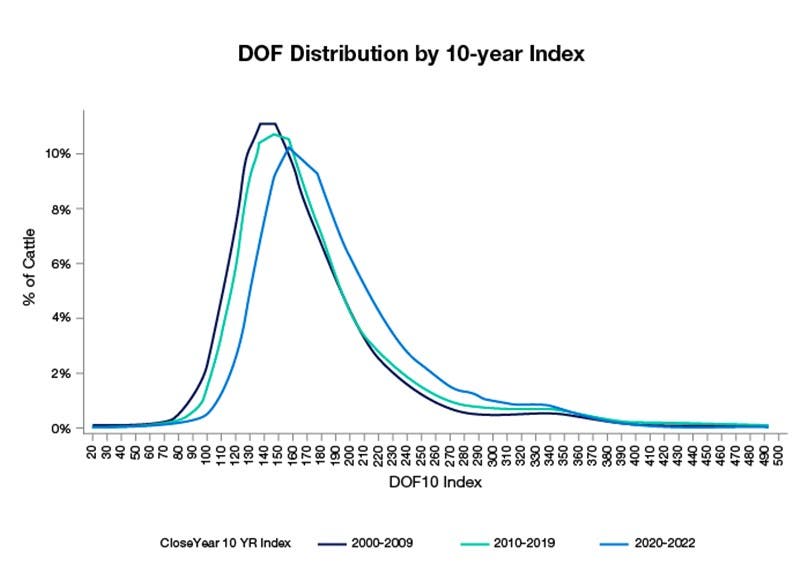
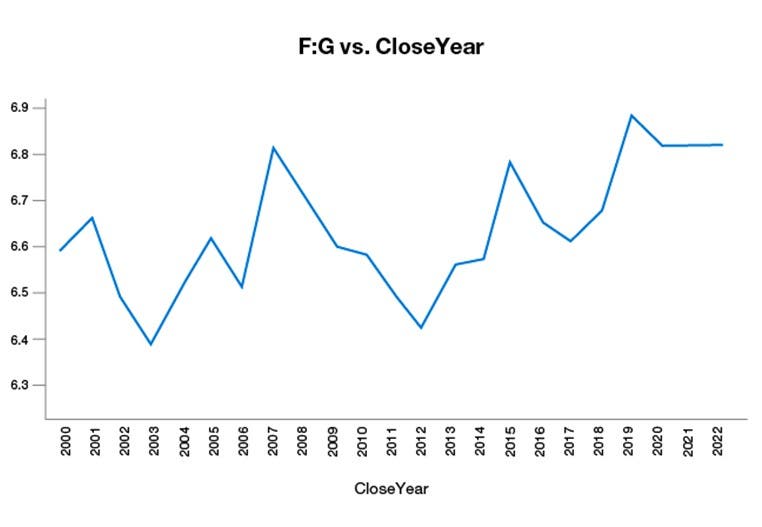
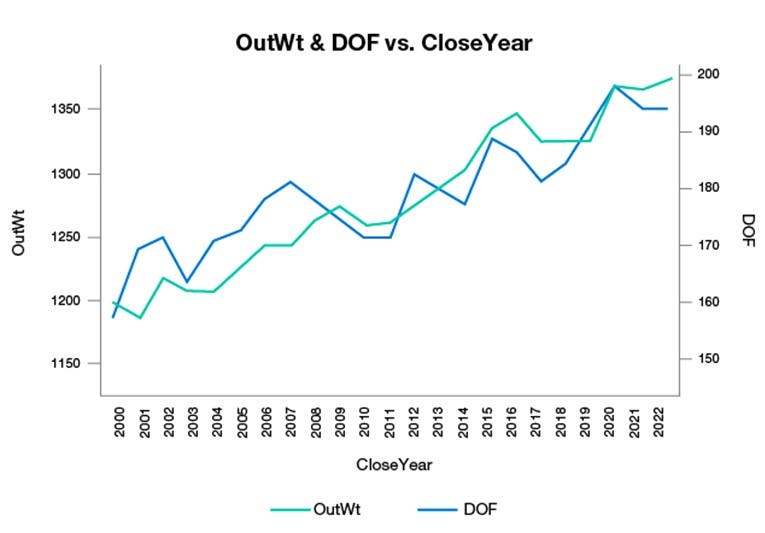
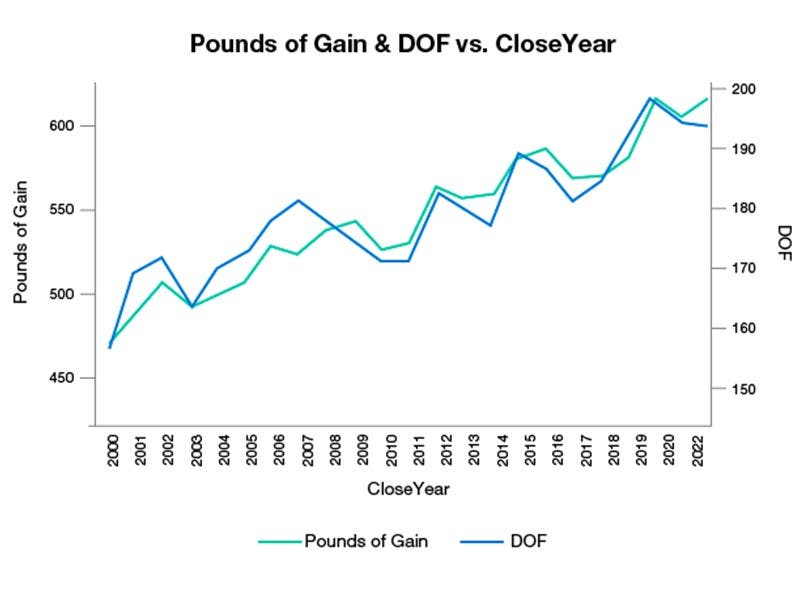
Figures 5a-d. All Elanco Benchmark data. Includes user described cattle types: Steers, Heifers, Mixed and Holsteins. (Includes PLA).
Results & Analysis
DOF, Cattle Performance, and Feedyard Efficiency
The DOF distribution (Figure 5a) illustrates the wide variety of feeding durations represented within Benchmark with measurable populations of cattle being fed in confinement from 110 to 379 days in the years 2020-2022. Benchmark and other data sources can be used to capture a snapshot of feedyard cattle performance and operational efficiency based on a sizeable population of the U.S. fed cattle industry. By several performance metrics, Benchmark feedyards continue to enhance cattle performance and efficiency (USRSB goal). Pounds of gain, harvest weight, carcass weight, yield and average daily gain are all increasing or remaining constant over time (Appendices 1 and 2). However, the F:G ratio has increased (indicating decreased efficiency) since 2019 (Figure 5b). DOF has increased over time with the mode DOF in 2020-2022 being 160-169 days (Figure 5c). The pounds gained in the feedyard (Figure 5d) as a percent of total pounds per animal harvested has increased from 38.7% in 1999 to 45.0% in 2022.
Air & Greenhouse Gas Emissions: Feedyard
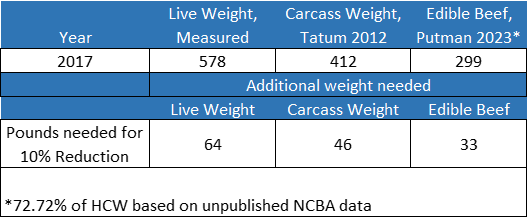
The USRSB states: “The feedyard sector will reduce greenhouse gas emissions by 10% per pound of beef by 2030” verses a 2017 baseline. Three metrics to illustrate “pounds of beef” are shown below in Table 5. The first is the live pounds of gain reported in Appendix 1 below, the second uses the formula in Tatum 20126 to calculate the carcass weight of cattle at placement to predict carcass weight gain within the feedyard [Placement carcass weight, kg = 0.2598 * In Weight,kg1.1378 ] , and the third uses the carcass weight to edible beef conversion factor reported in Putman 20239 to predict the pounds of edible beef gain within the feedyard. The final portion of Table 3 shows the needed increase in productivity per animal to meet the USRSB goals assuming no change in the total GHG emissions from the feedyard sector or DOF. Pounds of live weight gain has increased in the feedyard by 40 pounds to 618 pounds in 2022, but DOF has increased by 14 days as well.
Table 3. Predicted pounds of gain within the feedyard sector and estimated extra pounds of gain needed (holding emissions of the feedyard sector constant) to meet USRSB goals.
Several recent studies (Crawford et al 202210, Horton et al 202311, and McAtee et al 202412) have modeled GHG emissions in the feedyard based on the Intergovernmental Panel on Climate Change (IPCC) GHG accounting guidelines13 and related emissions to productivity by reporting GHG emissions per pound of weight gain. In these studies, diet formulation, manure management and climate were held constant. Horton varied animal health treatment protocols, McAtee varied feed additive usage while Crawford reanalyzed several studies that varied feed additives and hormone implant usage. In many of the IPCC GHG accounting equations, the amount of feed eaten by the cattle has a linear impact on GHG emissions produced. Specifically, emissions from feedlot operations including the production, grain processing and transport of feed increase with the amount of dry matter feed delivered to cattle13. Enteric methane emissions increase with the amount of feed eaten by cattle (IPCC 2019 Equation 10.21A13). Manure methane emissions increase with the amount of feed eaten by the cattle (IPCC 2019 Equation 10.2413) while manure nitrous oxide emissions increase with the amount of feed eaten by cattle minus the amount of nitrogen retained by them (IPCC 2019 Equation10.3113). Some electricity and fuel emissions do not increase with increased feed (ex. Fuel and electricity emissions at the feedyard office). Taking data from Crawford 2022 (Figure 6) and reanalyzing shows R2 values of 0.99 and 0.97 when regressing GHG emissions per pound of gain in the feedyard versus F:G ratio of 1990 and 2020, respectively.10
Figure 6. Reanalyzing Crawford 2022, kg CO2e / kg of live weight gain in the feedyard versus F:G ratio.10
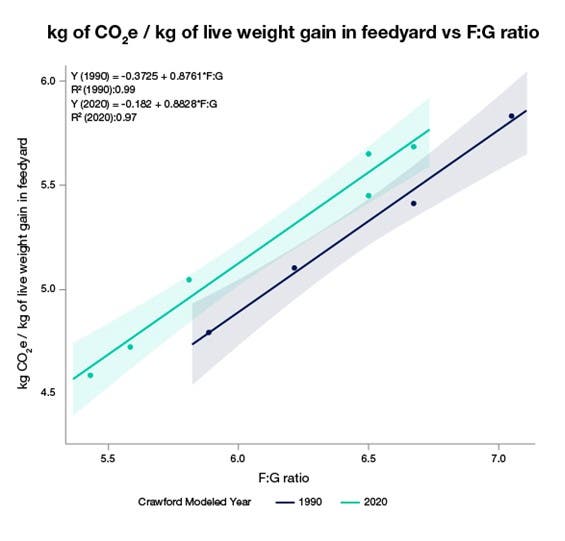
Thus, there is evidence that F:G ratio can be a proxy for emissions per pound of gain in the feedyard when diet formulation, manure management and climate are held constant. Considering the F:G ratio of 2017 in Benchmark was 6.60 and using the regression equation from Figure 6 for the year 2020:
kg CO2e / kg of body weight gain in feedyard = -0.182+0.8828 * F:G ratio
predicts reducing F:G ratio to 5.961 (-0.639 or -9.6%) by 2030 would correlate with a 10% reduction in GHG emissions per pound of beef gain in the feedyard meeting the USRSB goal. However, observed F:G ratio in 2022 has increased to 6.84.
Therefore, two readily accessible performance metrics used by the industry as proxies for GHG emissions per pound of beef gained in the feedyard are proposed:
- Pounds of gain at constant DOF
- F:G ratio when DOF are not constant.
These metrics do not capture the full complexities of GHG emissions and do not account for interventions that reduce emissions from feed production, changing fuel sources, manure management systems, or ration changes to impact enteric methane emissions per pound of feed or other interventions. These metrics do not replace the need for life cycle assessments for GHG emissions. The metrics are merely presented to help engage feedyard participants in the GHG aspect of sustainability in their common language: efficiency.
Air & Greenhouse Gas Emissions: Life Cycle Emissions
If cattle are placed into the feedyard at the same age, then increased DOF likely increases the total GHG emissions of the cattle. It is of interest to explore whether additional days of emissions are balanced by additional harvest weight of the cattle. Assuming 365 days of life for the beef cow to produce a beef calf and 270 days to raise the beef calf until feedyard placement, then this relationship can be explored using the DOF and harvest weight of cattle from Benchmark (Table 4).
Table 4: Modeled % change in days to harvest and actual change in pounds harvested per head.

This model suggests the added live weight pounds of gain within the feedyard from 2017 to 2022 reduced the days per pound of beef produced and possibly contributed lower GHG emissions per pound of beef produced over the entire animal life cycle despite the extra seven days on feed.
Discussion
Over the past several decades, the U.S. feedyard industry has seen numerous opportunities for structural and technological improvements. For example, there has been improved computing capacity, machinery technologies, increased byproduct (e.g., distillers’ grains) availability for cattle feed, improved genetic testing and selection and a variety of new pharmaceuticals enhancing health and performance. Feedyard managers have adapted to these practices and capabilities, resulting in consistently more pounds of beef per animal harvested.
However, it is important to recognize two realities. First, these improvements in efficiency are a result of structural and technological improvements incentivizing feedyards to increase DOF to maximize productivity per animal. Concurrently, consumer preferences are encouraging and incentivizing producers to give up the efficient technologies and management practices: grain fed, fed in confinement, hormones, growth promoters, etc. In this dataset, there is a growing segment of cattle raised without one or more productivity enhancing technologies, such as hormone implants or beta-agonists. A reduction of hormone implant usage from 97.0% in 2017 to 93.1% in 2022 based on mapped animal health data is observed.14 Usually, opting out of hormone implant usage is coupled with opting out of additional technologies. While the reduction in use of these technologies is small, research indicates that conventionally finished cattle result in 31% fewer emissions per finished animal compared to cattle finished without implants or conventional feed additives.15 When assessing the 3.9% reduction in cattle using hormone implants paired with an expected 31% increase in emissions for these animals, we could anticipate an increase of 1.2% in total emissions from the feeding sector. This increase in emissions from operations opting out of the use of hormone implants could exceed the sum of all other improvements made by the remaining 96.1% of participants during this time. A full assessment of the tradeoff decisions is beyond this paper's scope. However, it is imperative to understand that past efficiency improvements in the U.S. cattle feeding industry are not assured in the future if a continued trend of removing technology like hormone implants is observed.
A second important reality is the F:G ratio trend. If F:G ratio is used as a proxy for GHG emissions per pound of gain in the feedyard since DOF are increasing, then the industry is not on track to achieve the USRSB’s goal of a 10% reduction in GHG emission intensity by 2030 vs. 2017. Data within Benchmark demonstrates an increase in F:G ratio of 3.6% between 2017 and 2022. F:G ratio has increased since 2019 because the percentage of cattle within the dataset raised without one or more of the best management practices for efficiency has increased (ex. dry rolled corn vs steam flaked corn, non-use of hormone implants, non-use of beta-agonists, etc.). With the simple life cycle days model proposed, feedyards achieved 3.17% more pounds per animal harvested with only 1.66% more days in 2022 vs. 2017 for a days per pound reduction of 1.46%. A 1.46% reduction across five years equates to a 0.29% improvement per year, which suggests the U.S. beef industry is on track for a 3.8% reduction in days per pound harvested by 2030 vs 2017. While this is not an assessment of GHG emissions, following the example of Cooprider et al15 there is evidence of lower emissions per pound of beef when fewer days are necessary to achieve an amount of beef. However, the reduction in days per pound of beef harvested modeled in Benchmark is likely short of what is necessary to achieve many supply chain participants' goals of 30% reduction in GHG emissions per pound of beef produced across the entire beef life cycle. To meet the supply chain and USRSB goals for GHG emission reductions, the current rate of improvements in cattle performance and efficiency do not seem to meet the targets. We consider measurement to be a crucial step in achieving any goal, and we anticipate that the comprehensive data collection and rigorous nature of Benchmark will serve as a valuable tool in gauging progress. Two cattle performance metrics are described that would likely achieve USRSB goals, but many other pathways for GHG emission intensity reductions exist.
- USDA 2022 Steer & Heifer, https://www.ers.usda.gov/data-products/livestock-and-meat-domestic-data/
- Vogel, G. J., Bokenkroger, C. D., Rutten-Ramos, S. C., & Bargen, J. L. (2015). A Retrospective evaluation of animal mortality in US feedlots: Rate, timing, and cause of death. The Bovine Practitioner, 49(2), 113–123. https://doi.org/10.21423/bovine-vol49no2p113-123
- 2009-19 A Retrospective Evaluation of Animal Mortality in US Feedlots. 2019 Summer ASAS. Gary Vogel, PhD and Stephanie Rutten-Ramos, DVM, PhD
- W.C. Kayser, M.S. Brown, N.A. Pyatt, L.J. Walter, S.K. Linneen, C. Maxwell, B.P. Holland, A.B. Word, Effects of feeding duration, implant dose, and terminal window duration on growth performance and carcass characteristics of feedyard steers and heifers, Applied Animal Science, Volume 38, Issue 1, 2022, Pages 33-46, ISSN 2590-2865, https://doi.org/10.15232/aas.2021-02218.
- Mijares S, Calvo-Lorenzo M, Betts N, Alexander L, Edwards-Callaway LN. Characterization of Fed Cattle Mobility during the COVID-19 Pandemic. Animals. 2021; 11(6):1749. https://doi.org/10.3390/ani11061749https://doi.org/10.3390/ani11061749
- J. D. Tatum , W. J. Platter , J. L. Bargen , and R. A. Endsley, The Professional Animal Scientist 28 (2012):173-183
- USDA Cattle on Feed Survey, https://www.nass.usda.gov/Surveys/Guide_to_NASS_Surveys/Cattle_On_Feed/index.php
- Performance Livestock Analytics, Inc. https://performancelivestockanalytics.com/performance-beef/
- Ben Putman, C. Alan Rotz, Greg Thoma, A comprehensive environmental assessment of beef production and consumption in the United States, Journal of Cleaner Production, Volume 402, 2023, 136766, ISSN 0959-6526, https://doi.org/10.1016/j.jclepro.2023.136766.
- D.M. Crawford, K.E. Hales, T.M. Smock, N.A. Cole, K.L. Samuelson, Effects of changes in finishing diets and growth technologies on animal growth performance and the carbon footprint of cattle feeding: 1990 to 2020, Applied Animal Science, Volume 38, Issue 1, 2022, Pages 47-61,https://doi.org/10.15232/aas.2021-02199.
- Horton LM, Depenbusch BE, Dewsbury DM, McAtee TB, Betts NB, Renter DG. Comprehensive Outcomes Affected by Antimicrobial Metaphylaxis of Feedlot Calves at Medium-Risk for Bovine Respiratory Disease from a Randomized Controlled Trial. Veterinary Sciences. 2023; 10(2):67. https://doi.org/10.3390/vetsci10020067
- T B McAtee, D G Renter, T Murphy, N B Betts, B E Depenbusch, Cattle, carcass, economic, and estimated emission impacts of feeding finishing steers lubabegron or ractopamine hydrochloride, Translational Animal Science, 2024;, txae031, https://doi.org/10.1093/tas/txae031
- Olga Gavrilova (Estonia), Adrian Leip (EU), Hongmin Dong (China), James Douglas MacDonald (Canada), Carlos Alfredo Gomez Bravo (Peru), Barbara Amon (Germany), Rolando Barahona Rosales (Honduras), Agustin del Prado (Spain), Magda Aparecida de Lima (Brazil), Walter Oyhantçabal (Uruguay), Tony John van der Weerden (New Zealand), Yeni Widiawati (Indonesia) 2019: Emissions from Livestock and Manure Management In IPCC, 2019 : Refinement to the 2006 IPCC Guidelines for National Greenhouse Gas Inventories, Volume 4: Agriculture, Forestry, and Other Land Use, https://www.ipcc-nggip.iges.or.jp/public/2019rf/pdf/4_Volume4/19R_V4_Ch10_Livestock.pdf
- Elanco Benchmark. 2017-2022. Data on file.
- K. L. Cooprider, F. M. Mitloehner, T. R. Famula, E. Kebreab, Y. Zhao, A. L. Van Eenennaam, Feedlot efficiency implications on greenhouse gas emissions and sustainability, Journal of Animal Science, Volume 89, Issue 8, August 2011, Pages 2643–2656, https://doi.org/10.2527/jas.2010-3539
Appendix 1. All Elanco Benchmark data. Includes user described cattle types: Steers, Heifers, Mixed and Holsteins.
Harvest Year | # of Feedyards | # of Lots | Head Harvested | InWt (lbs) | OutWt (lbs) | Pounds of Gain | DOF | ADG (lbs/d) | F:G | Intake (lbs) | Yield, % | Carc Wt (lbs) |
1999 | 184 | 30,780 | 4,719,213 | 737 | 1202 | 465 | 153 | 3.10 | 6.64 | 20.41 | 63.87 | 762 |
2000 | 206 | 32,507 | 5,137,046 | 735 | 1198 | 463 | 155 | 3.03 | 6.68 | 20.01 | 64.26 | 758 |
2001 | 202 | 43,090 | 6,542,300 | 706 | 1188 | 482 | 169 | 2.89 | 6.77 | 19.28 | 64.18 | 764 |
2002 | 228 | 48,640 | 7,003,085 | 709 | 1218 | 509 | 174 | 3.00 | 6.50 | 19.34 | 64.24 | 781 |
2003 | 247 | 54,736 | 8,009,131 | 714 | 1210 | 496 | 166 | 3.04 | 6.41 | 19.36 | 63.98 | 776 |
2004 | 258 | 54,950 | 7,967,302 | 702 | 1207 | 504 | 173 | 2.98 | 6.51 | 19.23 | 63.73 | 771 |
2005 | 279 | 56,740 | 8,121,216 | 715 | 1229 | 514 | 176 | 2.98 | 6.62 | 19.58 | 63.84 | 779 |
2006 | 298 | 60,850 | 8,762,976 | 711 | 1249 | 538 | 183 | 3.00 | 6.53 | 19.45 | 64.25 | 797 |
2007 | 335 | 63,844 | 9,064,679 | 718 | 1249 | 531 | 185 | 2.94 | 6.81 | 19.77 | 63.99 | 795 |
2008 | 360 | 65,427 | 9,377,533 | 707 | 1268 | 561 | 180 | 3.08 | 6.73 | 20.44 | 64.17 | 812 |
2009 | 308 | 59,076 | 8,217,665 | 713 | 1279 | 566 | 177 | 3.15 | 6.65 | 20.79 | 63.98 | 812 |
2010 | 276 | 61,380 | 8,776,304 | 677 | 1265 | 588 | 173 | 3.13 | 6.60 | 20.43 | 64.01 | 811 |
2011 | 281 | 63,669 | 9,131,452 | 672 | 1267 | 595 | 172 | 3.17 | 6.49 | 20.33 | 64.30 | 814 |
2012 | 285 | 62,625 | 9,135,987 | 701 | 1279 | 578 | 183 | 3.16 | 6.41 | 20.09 | 64.54 | 827 |
2013 | 282 | 66,397 | 9,621,642 | 731 | 1293 | 561 | 181 | 3.19 | 6.54 | 20.66 | 64.30 | 830 |
2014 | 278 | 61,455 | 8,751,697 | 746 | 1312 | 566 | 179 | 3.24 | 6.55 | 21.01 | 64.10 | 836 |
2015 | 272 | 59,945 | 8,463,369 | 757 | 1345 | 588 | 191 | 3.15 | 6.76 | 21.06 | 64.22 | 856 |
2016 | 273 | 62,655 | 8,716,065 | 760 | 1355 | 595 | 190 | 3.22 | 6.65 | 21.18 | 64.10 | 863 |
2017 | 259 | 64,960 | 8,958,526 | 754 | 1332 | 578 | 184 | 3.21 | 6.60 | 20.96 | 64.06 | 849 |
2018 | 264 | 61,886 | 8,589,422 | 750 | 1328 | 578 | 188 | 3.15 | 6.68 | 20.77 | 64.37 | 849 |
2019 | 383 | 60,572 | 8,765,779 | 744 | 1330 | 586 | 194 | 3.08 | 6.89 | 20.92 | 64.26 | 848 |
2020 | 492 | 63,661 | 9,387,159 | 754 | 1374 | 620 | 201 | 3.16 | 6.83 | 21.28 | 64.46 | 874 |
2021 | 546 | 68,164 | 10,221,249 | 760 | 1368 | 608 | 197 | 3.16 | 6.83 | 21.31 | 64.20 | 861 |
2022 | 566 | 70,667 | 10,586,234 | 756 | 1374 | 618 | 198 | 3.19 | 6.84 | 21.58 | 64.08 | 861 |
Appendix 2. Elanco Benchmark data excluding PLA customers from 2018-2022. Includes user described cattle types: Steers, Heifers, Mixed and Holsteins.
Harvest Year | # of Feedyards | # of Lots | Head Harvested | InWt (lbs) | OutWt (lbs) | Pounds of Gain | DOF | ADG (lbs/d) | F:G | Intake (lbs) | Yield, % | Carc Wt (lbs) |
1999 | 184 | 30,780 | 4,719,213 | 737 | 1202 | 465 | 153 | 3.10 | 6.64 | 20.41 | 63.87 | 762 |
2000 | 206 | 32,507 | 5,137,046 | 735 | 1198 | 463 | 155 | 3.03 | 6.68 | 20.01 | 64.26 | 758 |
2001 | 202 | 43,090 | 6,542,300 | 706 | 1188 | 482 | 169 | 2.89 | 6.77 | 19.28 | 64.18 | 764 |
2002 | 228 | 48,640 | 7,003,085 | 709 | 1218 | 509 | 174 | 3.00 | 6.50 | 19.34 | 64.24 | 781 |
2003 | 247 | 54,736 | 8,009,131 | 714 | 1210 | 496 | 166 | 3.04 | 6.41 | 19.36 | 63.98 | 776 |
2004 | 258 | 54,950 | 7,967,302 | 702 | 1207 | 504 | 173 | 2.98 | 6.51 | 19.23 | 63.73 | 771 |
2005 | 279 | 56,740 | 8,121,216 | 715 | 1229 | 514 | 176 | 2.98 | 6.62 | 19.58 | 63.84 | 779 |
2006 | 298 | 60,850 | 8,762,976 | 711 | 1249 | 538 | 183 | 3.00 | 6.53 | 19.45 | 64.25 | 797 |
2007 | 335 | 63,844 | 9,064,679 | 718 | 1249 | 531 | 185 | 2.94 | 6.81 | 19.77 | 63.99 | 795 |
2008 | 360 | 65,427 | 9,377,533 | 707 | 1268 | 561 | 180 | 3.08 | 6.73 | 20.44 | 64.17 | 812 |
2009 | 308 | 59,076 | 8,217,665 | 713 | 1279 | 566 | 177 | 3.15 | 6.65 | 20.79 | 63.98 | 812 |
2010 | 276 | 61,380 | 8,776,304 | 677 | 1265 | 588 | 173 | 3.13 | 6.60 | 20.43 | 64.01 | 811 |
2011 | 281 | 63,669 | 9,131,452 | 672 | 1267 | 595 | 172 | 3.17 | 6.49 | 20.33 | 64.30 | 814 |
2012 | 285 | 62,625 | 9,135,987 | 701 | 1279 | 578 | 183 | 3.16 | 6.41 | 20.09 | 64.54 | 827 |
2013 | 282 | 66,397 | 9,621,642 | 731 | 1293 | 561 | 181 | 3.19 | 6.54 | 20.66 | 64.30 | 830 |
2014 | 278 | 61,455 | 8,751,697 | 746 | 1312 | 566 | 179 | 3.24 | 6.55 | 21.01 | 64.10 | 836 |
2015 | 272 | 59,945 | 8,463,369 | 757 | 1345 | 588 | 191 | 3.15 | 6.76 | 21.06 | 64.22 | 856 |
2016 | 273 | 62,655 | 8,716,065 | 760 | 1355 | 595 | 190 | 3.22 | 6.65 | 21.18 | 64.10 | 863 |
2017 | 248 | 64,771 | 8,887,763 | 755 | 1331 | 576 | 183 | 3.21 | 6.60 | 20.95 | 64.06 | 849 |
2018 | 233 | 61,485 | 8,499,018 | 750 | 1327 | 577 | 187 | 3.15 | 6.67 | 20.75 | 64.37 | 849 |
2019 | 235 | 59,465 | 8,566,541 | 744 | 1328 | 584 | 194 | 3.08 | 6.86 | 20.88 | 64.26 | 848 |
2020 | 245 | 61,052 | 8,963,393 | 752 | 1370 | 618 | 200 | 3.16 | 6.77 | 21.16 | 64.46 | 874 |
2021 | 261 | 64,719 | 9,676,276 | 759 | 1364 | 605 | 196 | 3.16 | 6.79 | 21.17 | 64.21 | 861 |
2022 | 274 | 66,941 | 9,989,172 | 755 | 1371 | 615 | 197 | 3.19 | 6.80 | 21.45 | 64.08 | 861 |
Benchmark, Elanco and the diagonal bar are trademarks of Elanco or its affiliates. ©2025 Elanco or its affiliates.
