What is PenPoint Market?
PenPoint Market is a collaboration between QT Data and Elanco Animal Health that bring together a robust futures trading platform with the extensive dataset from Elanco Benchmark to incorporate historical cattle feedlot performance into cattle purchasing decisions.
How is a breakeven applied to cattle feeding?
A breakeven business results when:
For cattle feeders costs represent the amount paid for the calves, medicine, labor, feed, and any interest if costs are financed. Revenue is the total weight of the animals marketed multiplied by a price per pound sold. There are multiple ways to sell cattle: live, in the meat or carcass. For simplicity, we will focus on a live cattle seller. The profitable cattle feeder must predict both costs and revenues: How much medicine, labor, and feed will the calves need? How much interest will there be at today’s rates? How many of the calves will survive until harvest? What will they weigh? What price can they be sold at and when? With an accurate set of predictions, the feeder can purchase feeder calves with confidence he or she will at least “breakeven,” with the goal being to purchase calves for less than breakeven and turn a profit.
Why is the PenPoint Market breakeven important?
Cattle feeders are predictors. They are trying to answer the question “Can I buy these cattle today, feed them, and at least breakeven?” The PenPoint Market model aims to make the predictions a little easier and more accurate. First, PenPoint Market utilizes actual historical cattle performance data from 24,877,026 million cattle (159,852 harvested lots) in Elanco’s Benchmark database1. Then, it recalculates historical costs with current market conditions by incorporating a cattle feeder’s current ration cost, yardage, and financing rates and applies the current futures prices from QT Data to predict the live cattle price at harvest. Finally, linear regression analysis based on purchase weight yields a specific breakeven price and the amount of variation in cattle performance (and calf value). This calculation provides a cattle buyer not only a “real time” guide to breakeven, but guardrails around the expected variation for higher than average performing cattle.
Hypothetical Example
Assume there are two sets of 750-pound steers available for purchase in a sale barn. For this example, assume 0% death loss, 0% financing, and equal veterinary labor and medicine charges of $25 per head. Feed costs $325 per ton of dry matter and feeding both groups lasts for 200 days. The two groups differ only in their intake and average daily gain. The “plain” group eats 22 pounds and gains 3.3 pounds per day, while the “premium” eats 26 pounds, but gains 3.8 pounds per day.
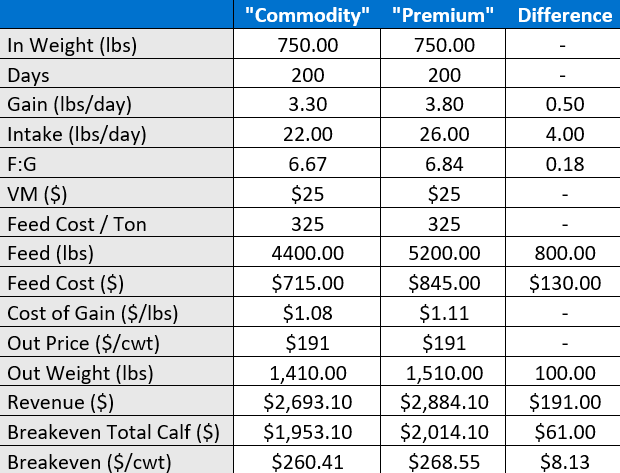
This simple scenario yields breakeven prices of $260.41 and $268.55 for the “plain” and “premium” cattle, respectively. The “premium” cattle perform much better than the “commodity” cattle due to the higher rate of gain, but the increased performance comes at a cost of an extra $130 of feed. The feeder calf expense is almost 73% of total costs and on the balance sheet the “premium” cattle are worth $8.13/cwt more than the commodity cattle at purchase. Procurement tradeoff decisions like this happen frequently for cattle feeders, especially during live auctions. Being able to accurately evaluate cattle value in real time can be the difference between over-valuing the “premium” cattle and buying the “plain” cattle at $260.41/cwt for a breakeven. Over-valuing could occur by accounting for the increased gain but neglecting the increased feed costs to purchase at $285.88/cwt for a loss of $130 per head on the “premium” cattle.
Real World Purchases
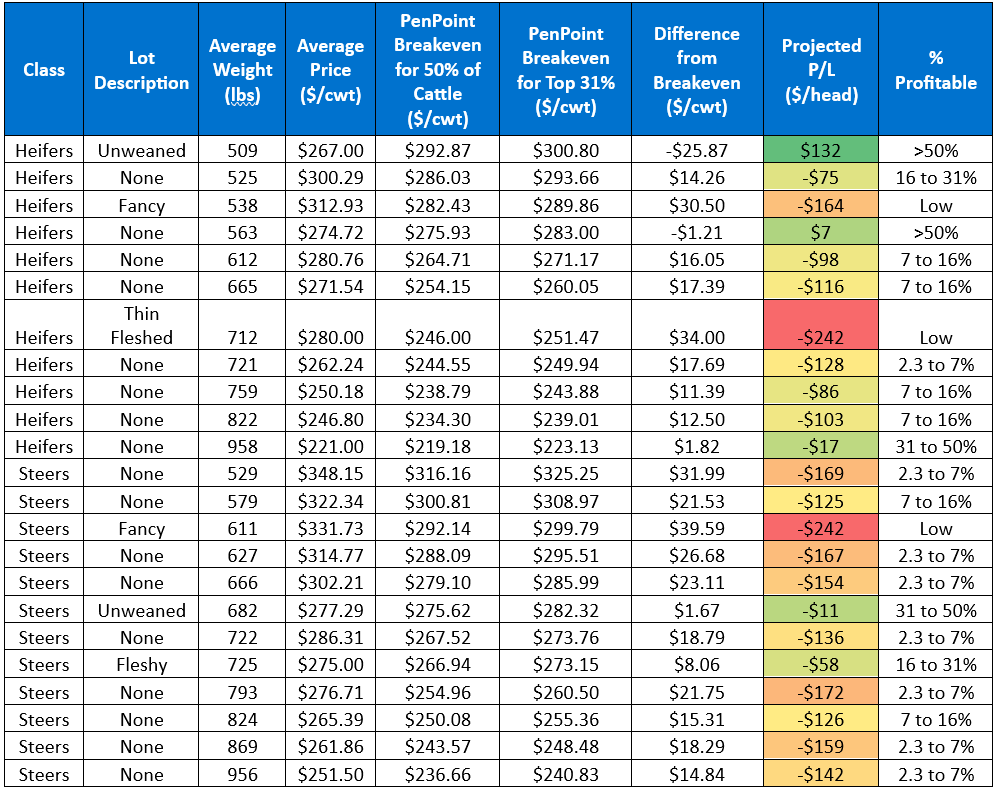
Sale barn purchases reported on 1/22/25 in El Reno, Oklahoma were evaluated using the PenPoint Market model2 for weights greater than 500 pounds. The daily closing futures price on 1/22/2025 was assumed for the sale of the harvest cattle. Cattle were assigned the futures contract expiring after the projected harvest date of the cattle. Model parameters assumed the cattle would be fed a steam flaked corn-based ration in Texas. Performance was assumed to be improved using 2025 practices, versus industry standard technology from 2020. Ration cost was assumed as $325 per ton including yardage fees based off Elanco Benchmark cattle closed in December 2024 in Texas and Oklahoma and financing at 7% interest. The average cattle weight and price are evaluated as well as the categorical assessment of the sales price versus the projected breakeven price for #1 steers and heifers is listed below.
Summary
In an underlying environment of low cattle supply numbers3 and the lowest prices for corn in 4 years,4 cattle feeders averaged purchase prices $16.09/cwt higher than the calculated breakeven from the PenPoint Market model. Considerable variation was observed with two winning bids below and 4 bids more than $30/cwt higher than the calculated breakeven. Lot descriptions are telling, with the two “Unweaned” lots being in the three relatively cheapest sales and the two “Fancy” lots being in the four most relatively expensive sales. In fact, according to the model the lots bought at $30.50, $39.59, and $34.00 above the breakeven were bought at 2.1, 2.6 and 3.1 standard deviations above the average breakeven price. There is very little historical evidence that cattle purchased this far above a breakeven can make money. The much more likely scenario is that any superior cattle performance potential detected in these cattle by a buyer is overpaid by the winner of the auction. Even if those lots of cattle end up breaking even, does a cattle feeder want to risk their time, money and energy in calves that have less than 2% chance of making money when cattle with 50%, 30% or even 20% chance of profitability could have been bought the same day? PenPoint Market can help customize a breakeven to a specific cattle feeder’s operation, helping manage the risk, in real time, of the cattle buyer’s purchasing decisions.
- Elanco Benchmark Database, Cattle closed 7/2017-6/2022 excluded 2019. Data on File
- https://mymarketnews.ams.usda.gov/public_data?slug_id=1281
- https://www.nass.usda.gov/Newsroom/2025/01-31-2025.php
- https://www.nass.usda.gov/Charts_and_Maps/Agricultural_Prices/pricecn.php
Benchmark, PenPoint, Elanco and the diagonal bar are trademarks of Elanco or its affiliates. ©2025 Elanco or its affiliates. PM-US-25-1066
